2012 NAEP Economics
Overall Grade 12 Scores on The Nation’s Report Card in Economics Are Flat
Lower-Performing Students Improve Since First Assessment in 2006
WASHINGTON (Apr. 24, 2013) — On average, the nation's 12th graders have not shown improvement in their knowledge of economics since 2006, according to the latest results from the National Assessment of Educational Progress (NAEP), also known as The Nation’s Report Card. However, gains in the scores of some student groups show signs of progress—among lower-performing students, Hispanic students, and students whose parents did not finish high school. All of these groups scored higher in 2012 than in 2006.
The Nation’s Report Card: Economics 2012, Grade 12 is NAEP's second economics assessment—the first having been administered in 2006—and showed that racial/ethnic achievement gaps between students did not narrow between 2006 and 2012.
Release Event: 2012 Economics
Experts discuss the 2012 economics assessment results during our webinar.
"It is astonishing that high school seniors do not know more about how economics affects their wallets, their country, and the world at a pivotal time in their lives, whether they choose to enter the workforce or pursue higher education," said David P. Driscoll, chair of the National Assessment Governing Board, which sets policy for NAEP. "We need to do more to educate all students in economics so they can make informed decisions, whether they are negotiating a car loan, voting, or reading financial news."
The Nation's Report Card informs the public about the academic achievement of elementary and secondary school students in the United States. Report cards communicate the findings of NAEP, a continuing and nationally representative measure of achievement in various subjects over time that is administered by the National Center for Education Statistics within the U.S. Department of Education. Results for NAEP Economics 2012 are based on a nationally representative sample of 10,900 12th-grade students in 480 public and private schools.
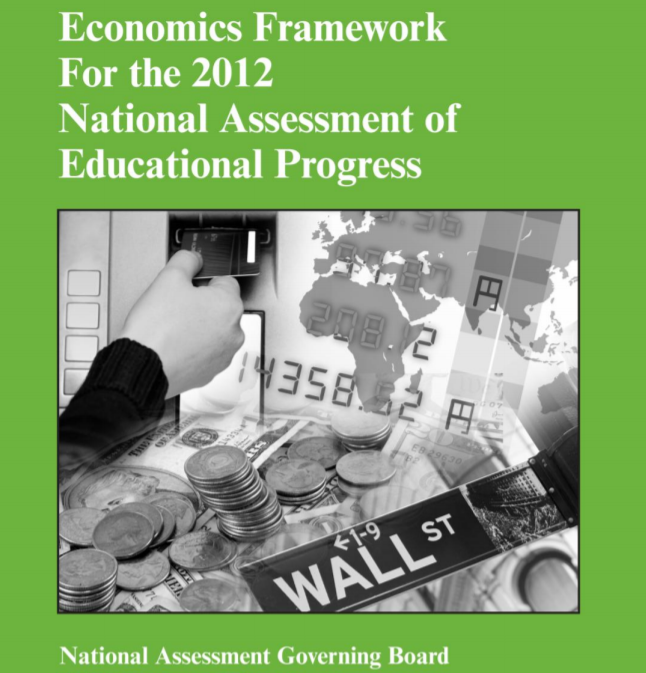
The assessment covers three main content areas: the market economy, national economy, and international economy. The test is grounded in real-world contexts, allowing students to demonstrate their knowledge by answering questions about personal finance, business, government policy, and international trade.
The market economy questions address the area commonly known as microeconomics, which includes concepts about business and consumer decisions. For example, when asked what would happen to the demand for grapes following a steep increase in price, only 9 percent of 12th graders correctly explained that the demand would decrease as consumers seek less expensive goods.
Questions about the national economy measure knowledge of macroeconomics, or the sum of economic decisions made by individuals, businesses, and the government. For example, the section devoted to the national economy asks students to explain how unemployment affects consumer spending—and ultimately the economy.
International economy questions explore how national economies interact with one another. Key concepts include the comparison of benefits and costs of specialization and trade for consumers, producers, and governments. Students are asked, for example, to analyze how U.S. manufacturers, workers, and consumers could be affected by a tariff on imported steel.
The 2012 economics assessment results are reported as average scores on a scale of 0 to 300 and also by three achievement levels: Basic, which denotes partial mastery of the knowledge and skills needed for proficient work; Proficient, which represents solid academic performance; and Advanced, which represents superior work.
While there was no overall change in the average economics score, the percentage of students scoring below the Basic level decreased, from 21 percent in 2006 to 18 percent in 2012—meaning that lower-performing students did better in 2012. Also, a higher percentage of Hispanic students scored at or above Basic, increasing from 64 percent in 2006 to 71 percent in 2012.
Students who reported higher levels of parental education also were more likely to perform at or above Proficient than students who reported lower levels of parental education. Although the percentage of students performing at each achievement level did not change from 2006 to 2012, the average scale scores increased 5 points for students who said their parents did not finish high school.
As part of the assessment, students are asked a series of questions that relate to their understanding of economics. The assessment found that the percentages of students seeking information about the U.S., international, and local economies increased in 2012 from 2006. Twelfth-graders who more frequently sought information about economics scored higher than students who did so less frequently.
"These results show that financial literacy can be learned both in and out of the classroom," Driscoll said. "Yet even with economics in the daily news headlines, there has been virtually no change in students' understanding of these important issues. This simply must change if they are to become financially responsible adults and stewards of our nation’s economy."
The Nation's Report Card: Economics 2012, Grade 12 is available at www.nationsreportcard.gov.
Stephaan Harris
- Phone
- (202) 357-7504
- Stephaan.Harris@Ed.Gov