Technology and Engineering Literacy
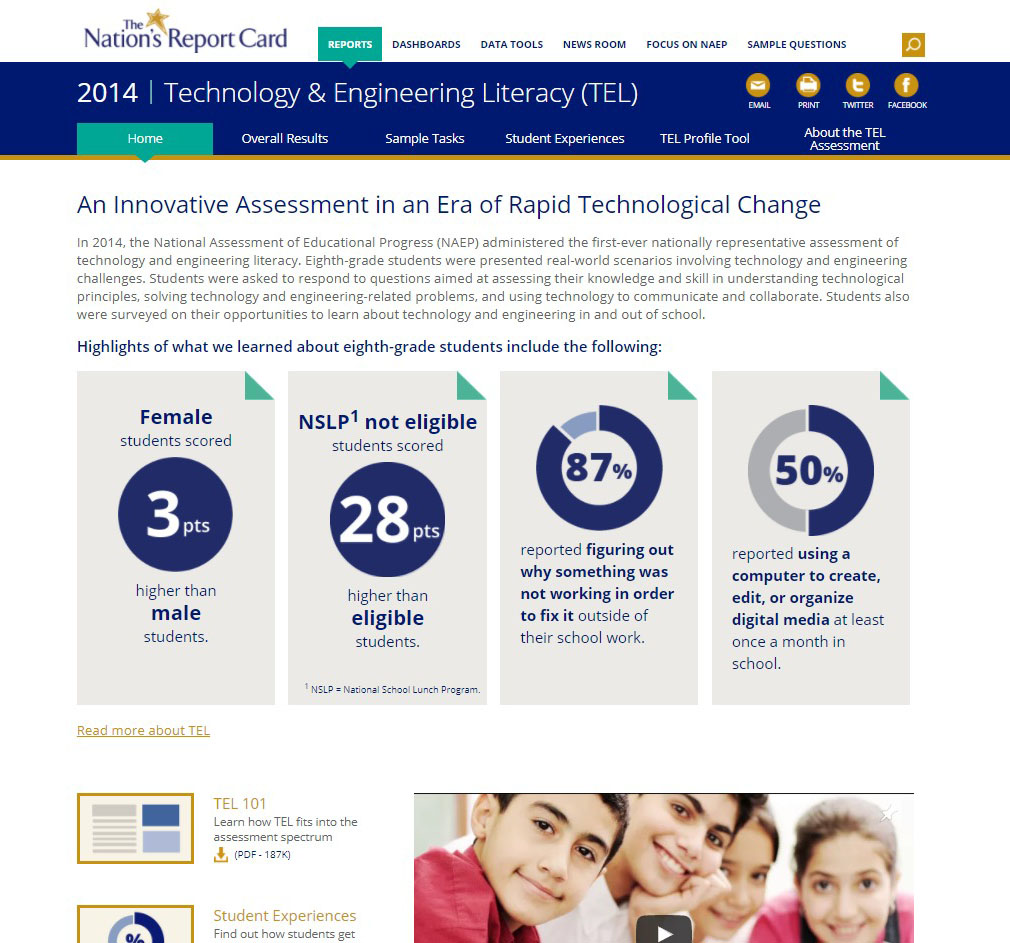
First-ever Nation’s Report Card for Technology and Engineering Literacy measures how eighth-graders solve real-world problems using innovative scenario-based tasks on computer
Assessment finds 43 percent of students Proficient, provides insight on in-school and out-of-school experiences
WASHINGTON — The National Assessment of Educational Progress (NAEP) produced the first-ever nationally representative assessment of technology and engineering literacy, using innovative, scenario-based tasks on computers to measure eighth-graders’ understanding of the use and effects of technology in their lives. On the assessment, also known as The Nation’s Report Card, students interacted with multimedia tasks using an assortment of tools to solve practical problems.
Student Impressions of TEL
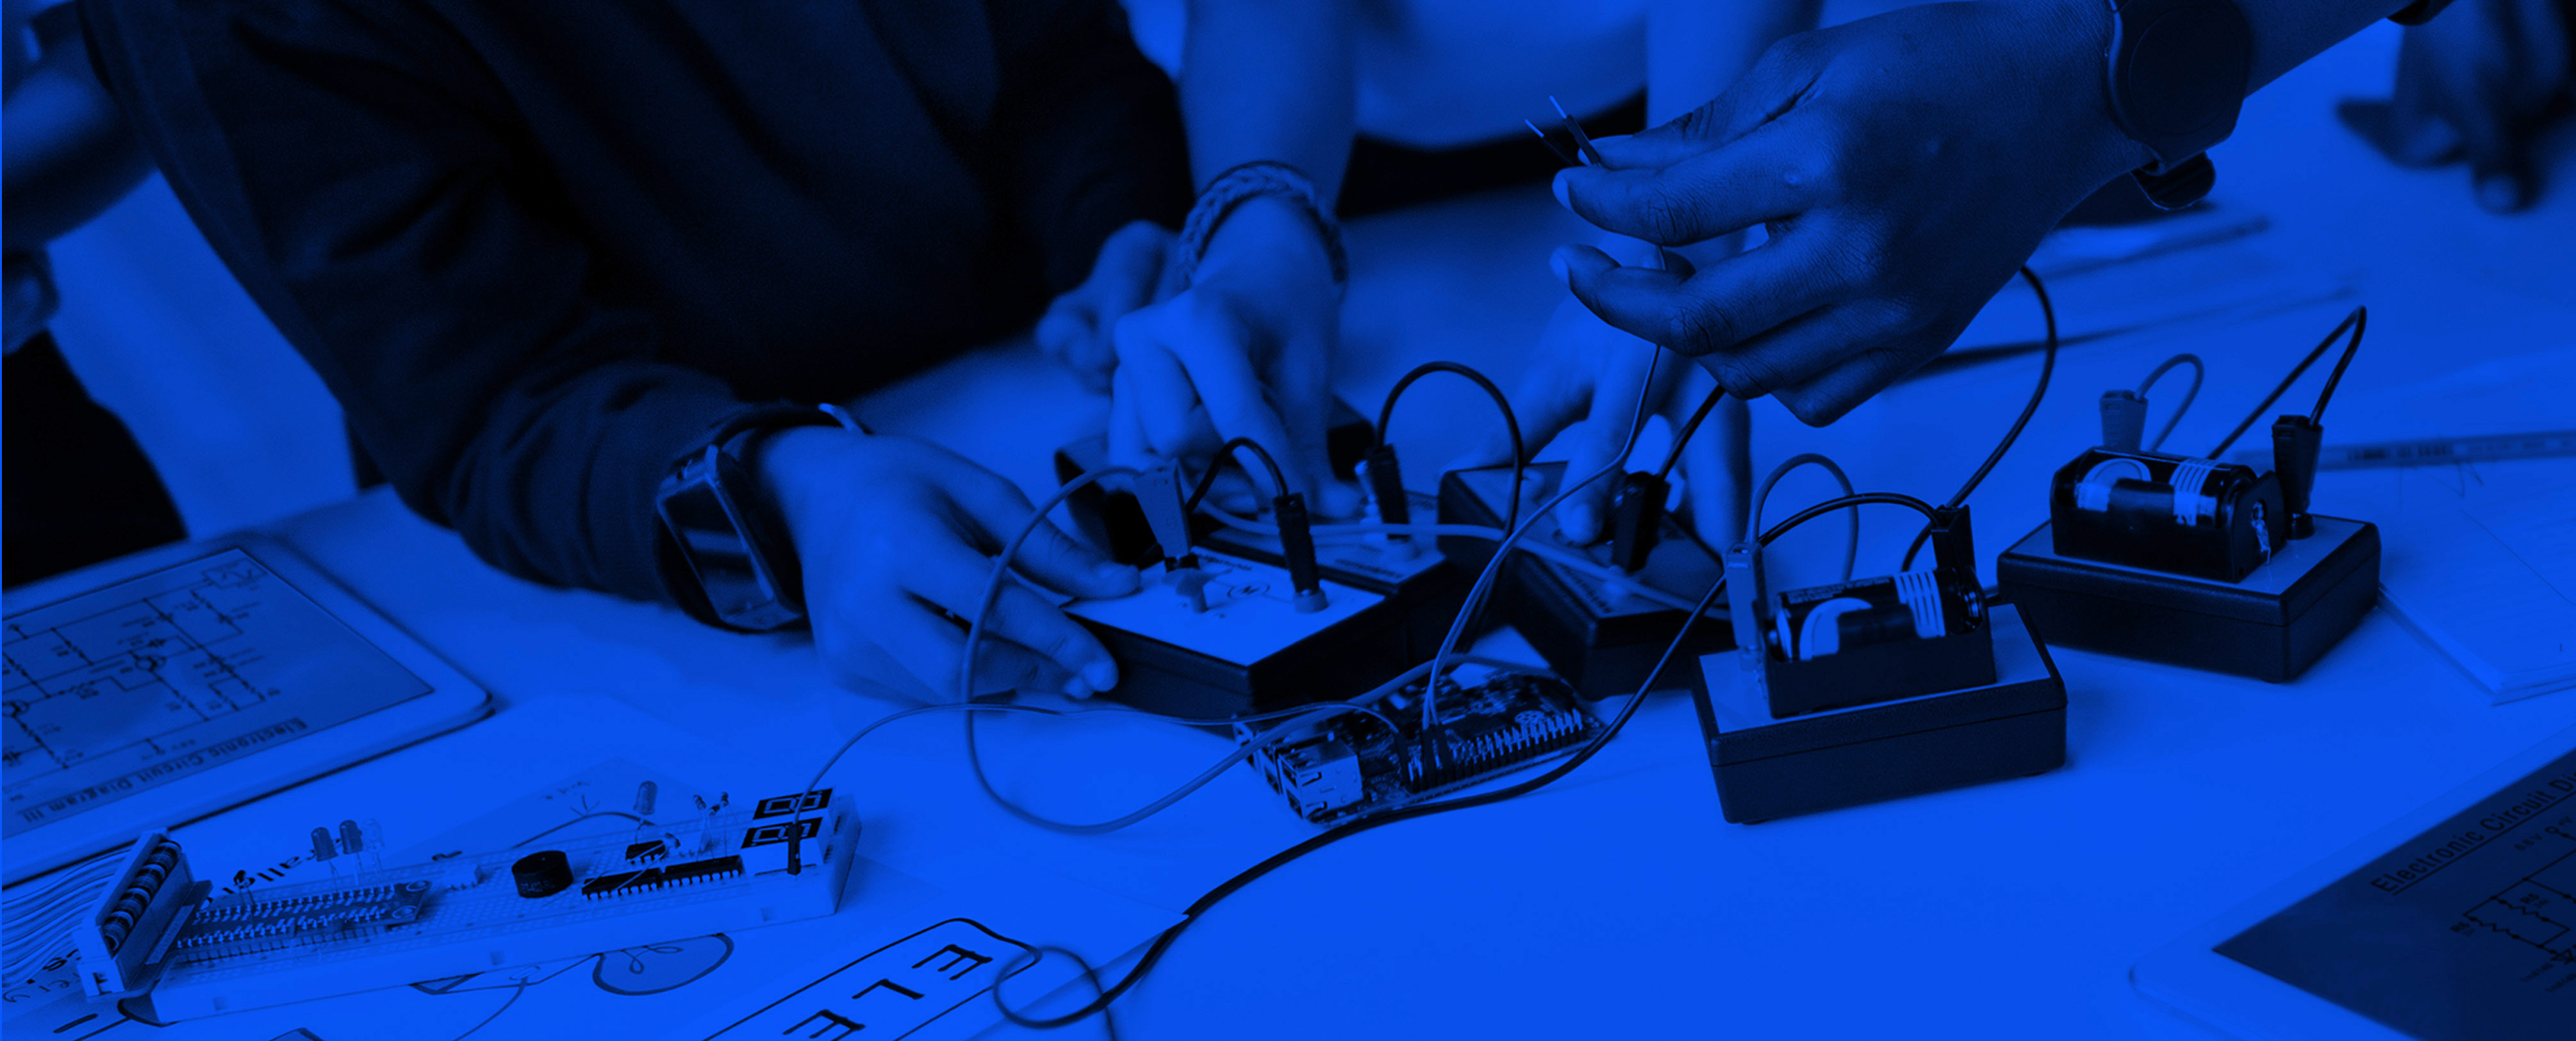
We asked eighth-graders from a STEM-focused middle school in Detroit to try an interactive task from the NAEP TEL assessment.
The Nation’s Report Card: Technology and Engineering Literacy (TEL) provides results on students’ performance and related experiences both in and out of school. Forty-three percent of eighth-grade students performed at or above the Proficient level on questions that revealed skills in thinking through problems systematically, using technology and engineering information built into each task to arrive at the best solutions.
“We live in a world of rapid technological change, and our nation’s continued prosperity rests on how we can use technology to innovate. Until now, there has been no way to assess this skill," said Terry Mazany, Chair of the National Assessment Governing Board, which oversees NAEP. “This assessment requires students to examine evidence, ask and answer challenging questions, and choose the right tools for the problem at hand. This is the exact kind of thinking that the modern world demands at home and in the workplace, no matter the career path."
Questionnaires also asked students where and how they developed these technology and engineering skills. Fifty-two percent of students reported taking at least one course related to technology or engineering in school. Fifty-nine percent reported that they sometimes learned about various topics related to technology and society in school. And nearly two-thirds of eighth-graders (63 percent) indicated that their family members most often taught them about building things, fixing things, or understanding how things work. Nineteen percent of students responded that they taught themselves, and 13 percent of students reported that they learned from their teachers.
The report, which uses scenario-based tasks along with traditional questions administered on computers, correlates these types of experiences with performance. Students who learned about technology- and society-related topics more frequently in school scored higher on average than those who did so less frequently. The same held true for students who learned about technology- and society-related topics more frequently outside of school.
“The scores clearly show that when students have opportunities to engage with technology and engineering, they become fluent in the skills that prepare them for living and working in the modern world. But access to these opportunities from place to place is patchy," said Dr. Tonya Matthews, President and CEO of the Michigan Science Center. “That’s a call for communities to create opportunities where needed, from schools to science centers to after-school programming.
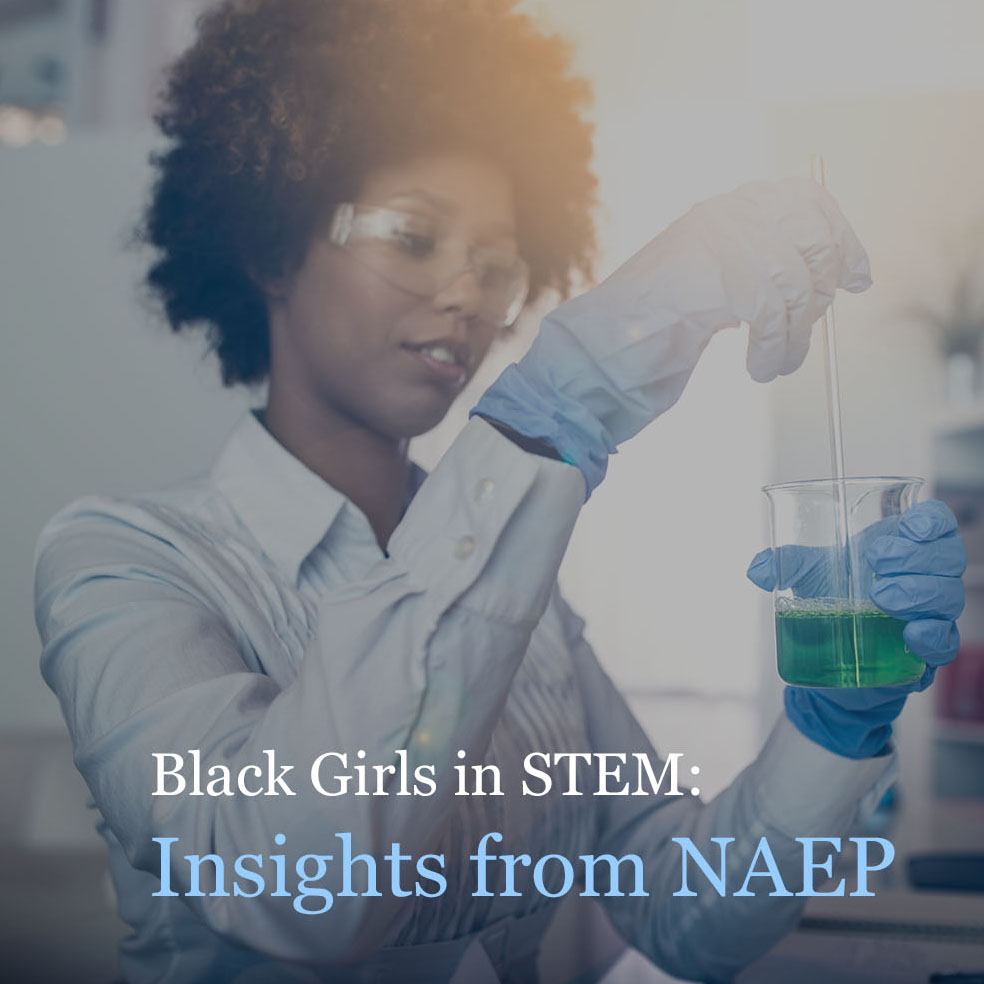
Students attending schools in suburban locations scored higher in TEL than their peers in town and city locations. Surprising to some, female white and female black students outperformed their male peers in TEL overall, while female Hispanic and female Asian students kept pace with, but did not exceed, their male peers. In addition, 25 percent of lower-income students (those eligible for the National School Lunch Program [NSLP]) scored at or above the Proficient level, compared to 59 percent of higher-income students (those not eligible for NSLP). For English language learners, only 5 percent scored at the Proficient level.
Racial/ethnic differences were seen among percentages of students who scored at or above Proficient: 56 percent of White and Asian students, 45 percent of students with two or more races, 42 percent of American Indian/Alaska Native students, 30 percent of Native Hawaiian/other Pacific Islander students, 28 percent of Hispanic students, and 18 percent of Black students scored Proficient or above.
Students need opportunities to engage with technology and engineering to live and work in the modern world. Tonya Matthews, @mi_sci CEO
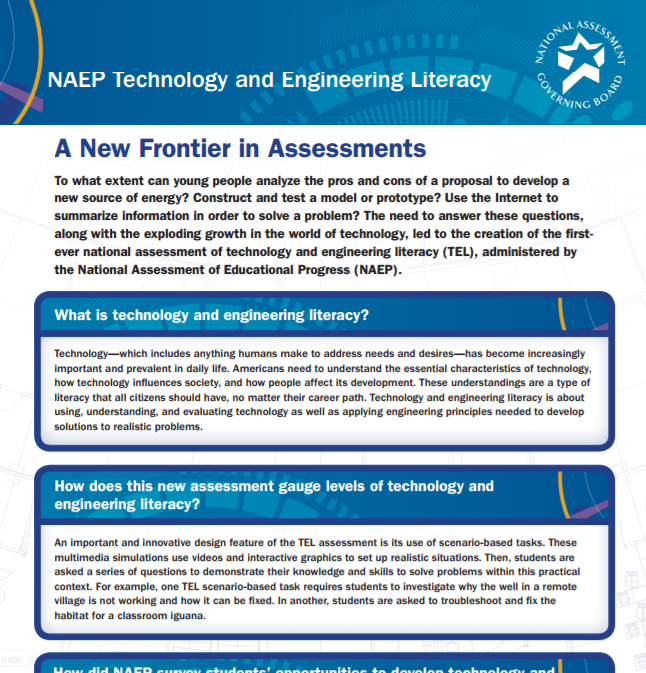
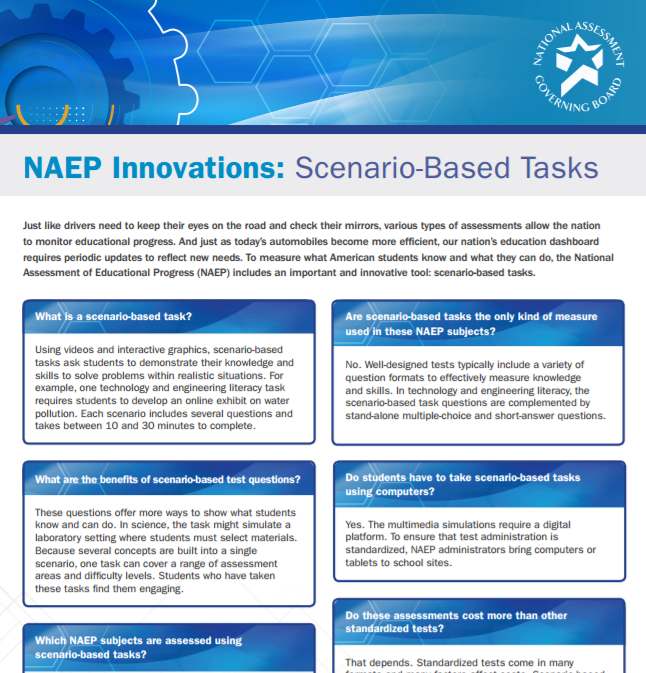
An important design feature of the TEL assessment is its use of scenario-based tasks. These dynamic, computer-administered tasks set up realistic situations in which students were asked to demonstrate their knowledge and skills to solve problems. This type of assessment offers insight into whether and how students can apply concepts in a meaningful way. Below is an example of an interactive computer task students completed:
Evaluate and explain how to improve the habitat of a classroom iguana
In the Iguana Home task, students helped troubleshoot and fix the habitat for a classroom iguana named Iggy. Students first learned about iguanas and their basic needs, then worked through the task to determine how best to improve Iggy’s environment. Below are steps students had to take given different problems Iggy experienced, and questions they responded to in the various scenarios.
Steps Required:
- Evaluating the Cage Design: Students consider design solutions and make predictions for solving the problem of Iggy’s cage being too cold.
- Further Evaluating the Cage Design: Students consider design solutions and make predictions for solving the problem of Iggy being awake and active at night.
- Testing the Cage Design and Evaluating Alternative Solutions: Students observe Iggy’s behavior to determine whether the proposed cage design solutions solve Iggy’s problem.
- Redesigning the Cage to Prevent Dehydration: Students select a cage design so that Iggy won’t become dehydrated in his cage.
Questions Asked:
- Iggy is always hanging on to his heat lamp! He does not want to be anywhere else. Based on the iguana facts, what is the most likely reason Iggy is hanging on to his heat lamp?
- Based on your observation of Iggy's behavior, what fact about iguanas is related to Iggy's second problem (Iggy is awake and active at night?)
- Based on Iggy's behavior, does option 1 work to solve Iggy's cold home?
- One of your classmates has done some research about iguanas and is worried that Iggy may get dehydrated, meaning his body will not get enough moisture. Based on what you have learned in this task about iguanas, which of these two items is best at preventing Iggy from getting dehydrated?
To learn more about this and other scenario tasks, visit the TEL page
A nationally representative sample of approximately 21,500 eighth-graders from over 800 public and private schools across the nation took the assessment in 2014. Student performance results are presented as NAEP achievement levels and average scale scores. Achievement levels are reported as the percentages of students performing at or above three performance levels (Basic, Proficient and Advanced). Basic denotes partial mastery; Proficient denotes solid academic performance; and Advanced represents superior work. Seven independent scales were developed for each of the three content areas (technology and society, design and systems, and information and communication technology), and for each of the three practices (understanding technological principles, developing solutions and achieving goals, and communicating and collaborating). Scale scores range from 0–300.
Explore the interactive TEL Report Card and TEL profile tool to compare student groups based on their performance and learning experiences with technology and engineering literacy, and watch explanatory videos to learn more about TEL.
Stephaan Harris
- Phone
- (202) 357-7504
- Stephaan.Harris@Ed.Gov