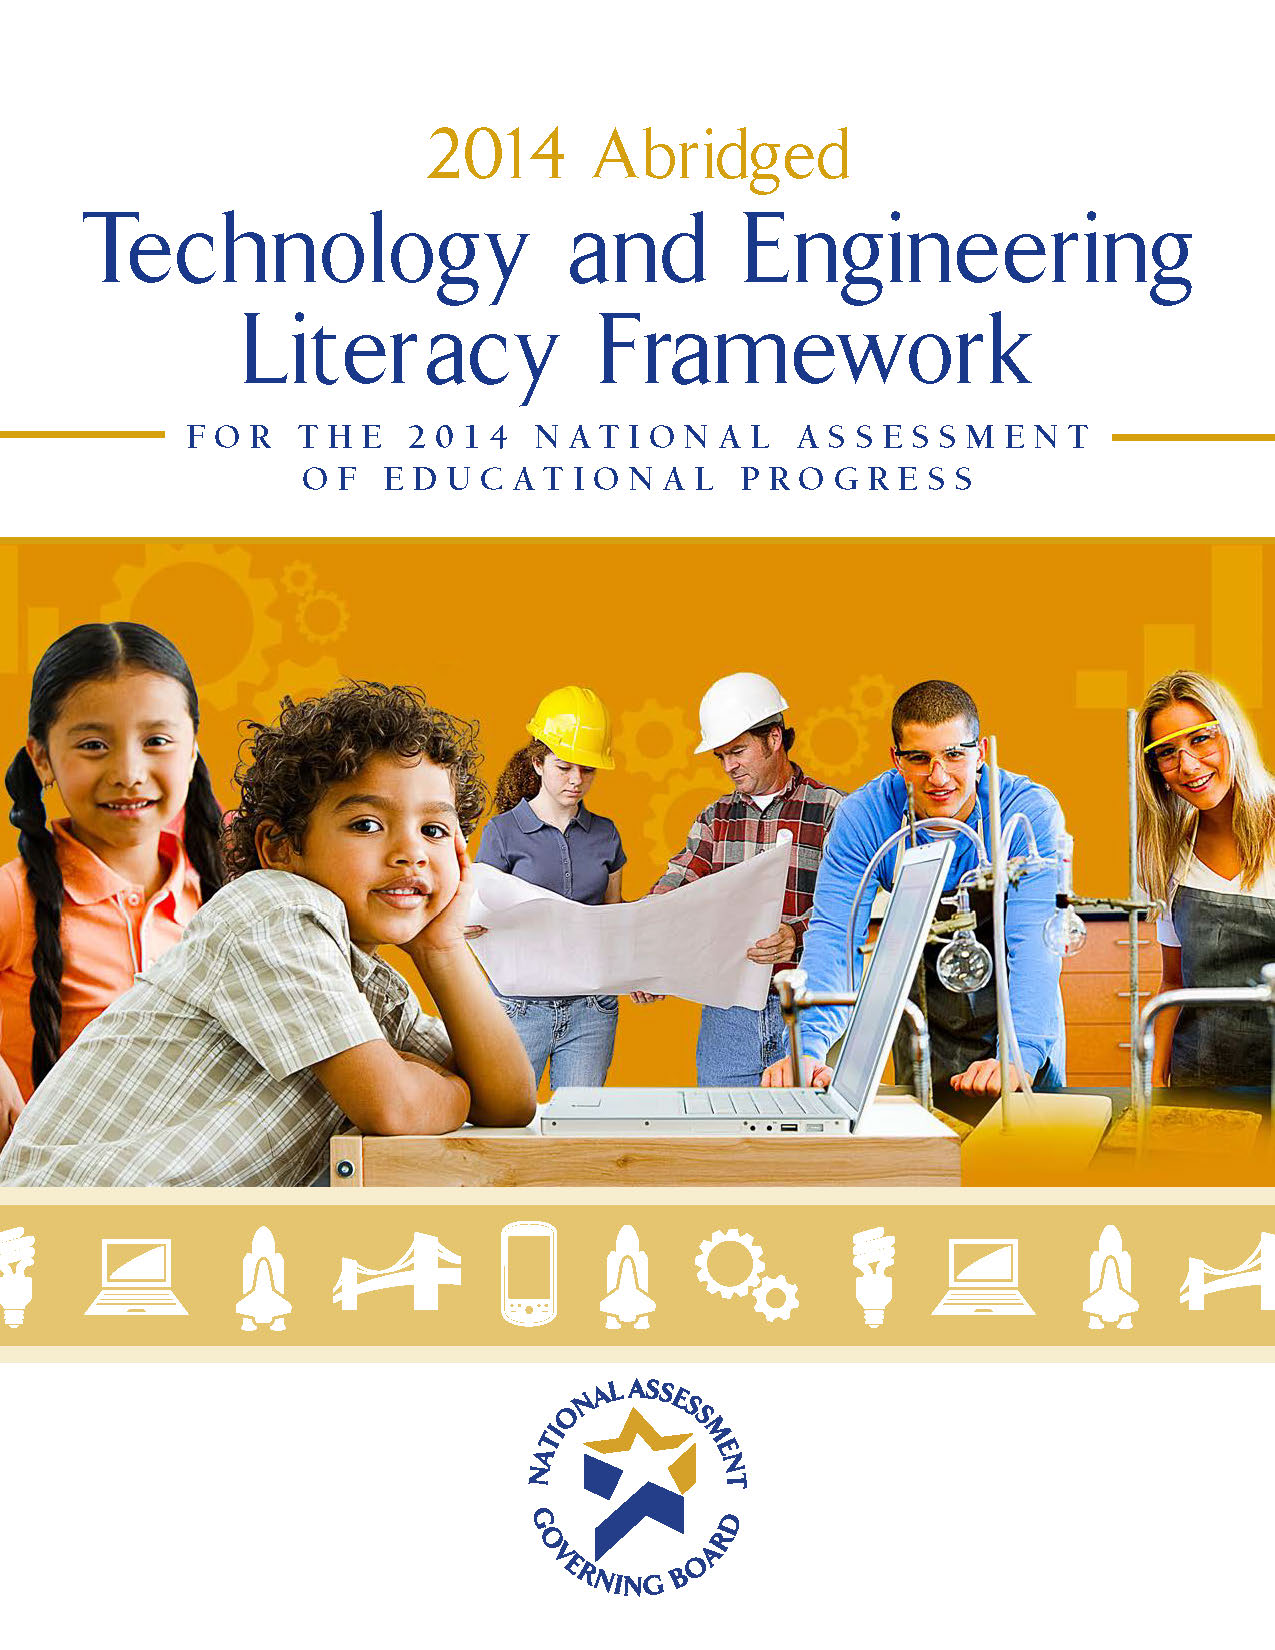
2014 Technology and Engineering Literacy
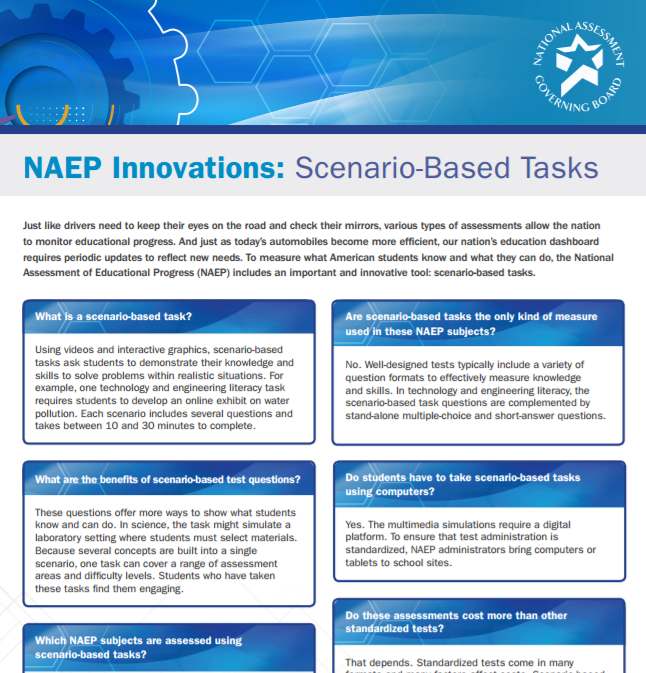
Technology and Engineering Literacy NAEP Uses Innovative Scenario-based Tasks
Assessment finds 43 percent of students Proficient, provides insight on in-school and out-of-school experiences
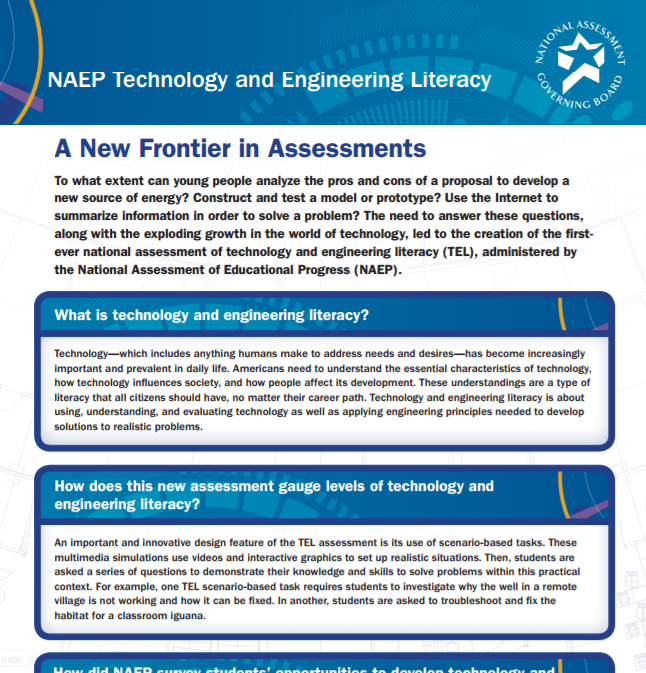
The National Assessment of Educational Progress produced the first-ever nationally representative assessment of technology and engineering literacy (TEL), using innovative, scenario-based tasks on computers to measure eighth-graders’ understanding of the use and effects of technology in their lives. Students interacted with multimedia tasks using an assortment of tools to solve practical problems. Forty-three percent of eighth-grade students performed at or above the Proficient level on questions that revealed skills in thinking through problems systematically, using technology and engineering information built into each task to arrive at the best solutions.
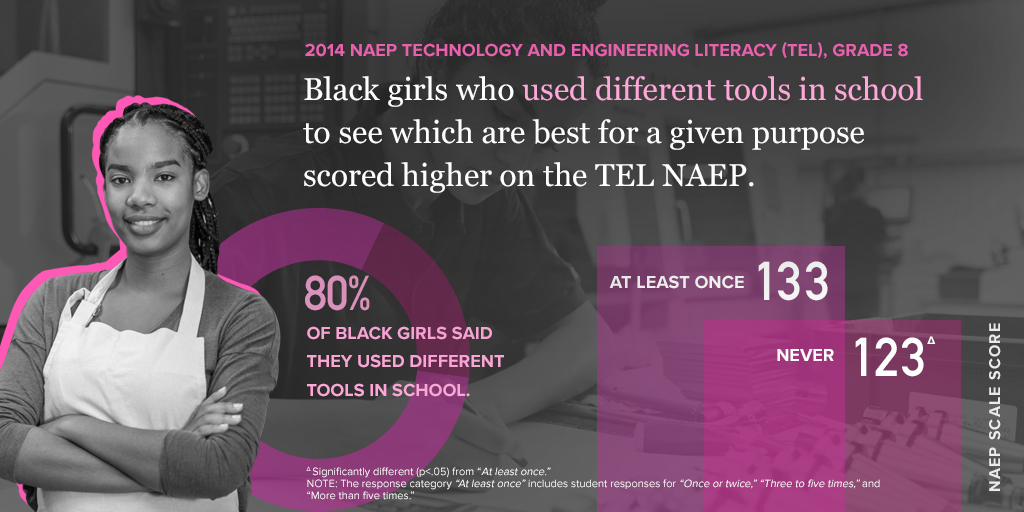
School Tools and TEL Achievement on NAEP
As part of our “Hidden Figures: Black Girls in STEM’ series, we explore how factors in and outside of the classroom affect students’ scores on the National Assessment of Educational Progress, as well as the insights and challenges the date present.
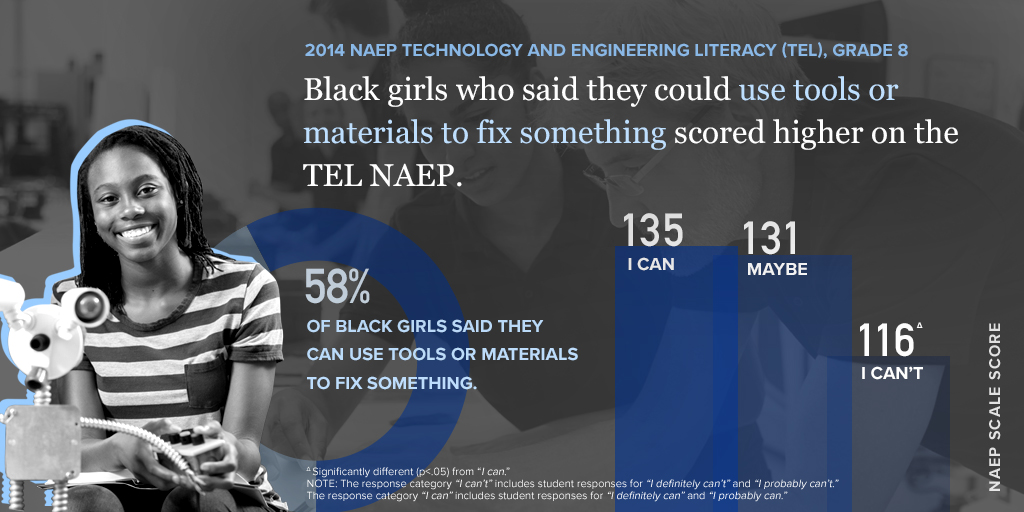
Fixing Things and TEL Achievement on NAEP
As part of our “Hidden Figures: Black Girls in STEM’ series, we explore how factors in and outside of the classroom affect students’ scores on the National Assessment of Educational Progress, as well as the insights and challenges the date present.
Black Girls in STEM: Insights from NAEP
As part of our “Hidden Figures: Black Girls in STEM’ series, we explore how factors in and outside of the classroom affect students’ scores on the National Assessment of Educational Progress, as well as the insights and challenges the data present.
Student Impressions on TEL
Eighth-grade students who tried one of the scenario-based tasks on the TEL assessment describe their experience.
An important design feature of TEL is its use of dynamic, computer-administered tasks that set up realistic situations in which students were asked to demonstrate their knowledge and skills to solve problems. In the Iguana Home task, for example, students helped troubleshoot and fix the habitat for a classroom iguana named Iggy. Students first learned about iguanas and their basic needs, then worked through the task to determine how best to improve Iggy’s environment.
Report Card Highlights
- Experiences and Performance. Students who learned about technology- and society-related topics more frequently in school and out of school scored higher on average than those who did so less frequently.
- Students attending schools in suburban locations scored higher than their peers in town and city locations.
- Female white and female black students outperformed their male peers in overall.
- Racial/ethnic differences were seen among percentages of students who scored at or above Proficient: 56 percent of White and Asian students, 45 percent of students with two or more races, 42 percent of American Indian/Alaska Native students, 30 percent of Native Hawaiian/other Pacific Islander students, 28 percent of Hispanic students, and 18 percent of Black students.
Stephaan Harris
- Phone
- (202) 357-7504
- Stephaan.Harris@Ed.Gov