2015 NAEP Science Release Event
The Nation’s Report Card Shows Higher Percentages of 4th- and 8th-Graders Reached Proficient Level in Science in 2015 Than in 2009; Black-White Score Gaps and Hispanic-White Score Gaps Narrow in Grades 4 and 8
No Change Among 12th-Graders
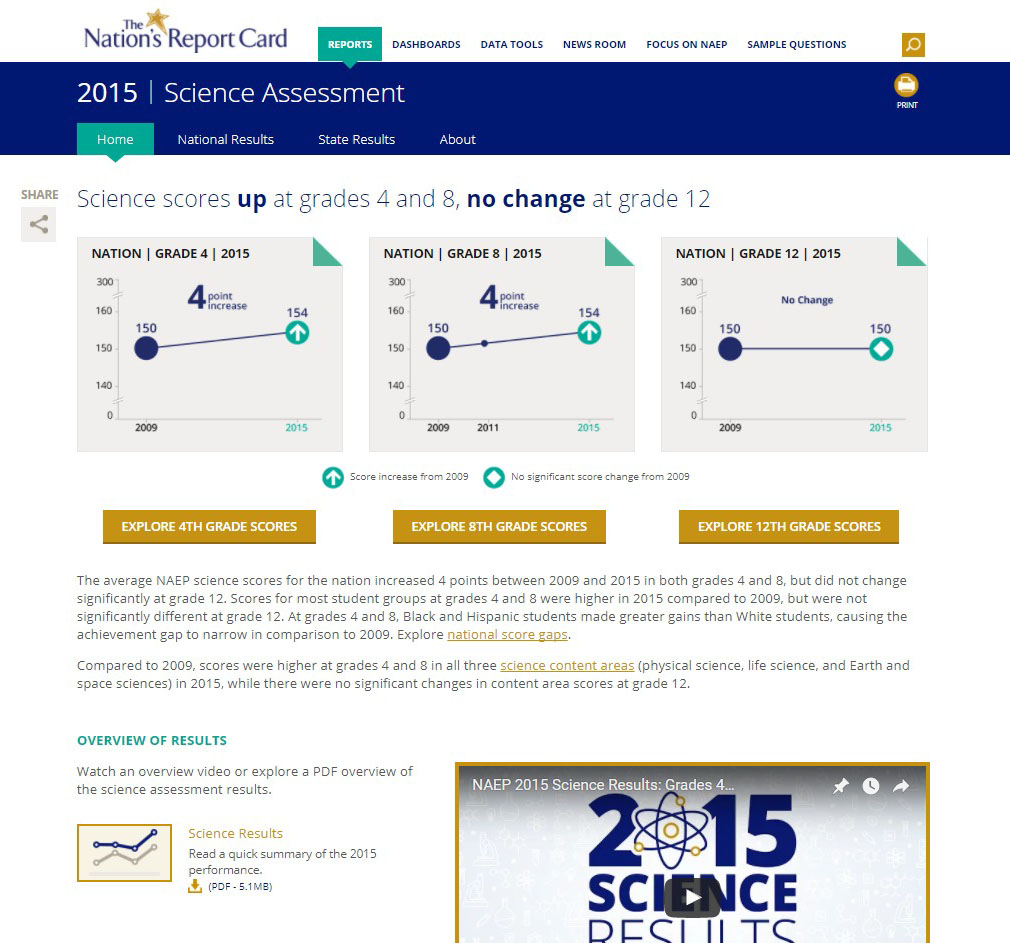
WASHINGTON — The Nation’s Report Card: 2015 Science shows scores have improved overall, and higher percentages of the nation’s fourth- and eighth-grade students demonstrated mastery of science on the 2015 assessment compared with the 2009 assessment. The results also show score gaps narrowing by race/ethnicity. The average score of 12th-grade students did not change between 2009 and 2015.
In 2015, 22 percent of 12th-graders performed at or above the Proficient achievement level, which denotes competency over challenging subject matter. Additionally, 38 percent of fourth-graders and 34 percent of eighth-graders performed at or above Proficient — an increase of 4 percentage points at both grades compared with 2009.
NAEP Science 2015: “When I Grow Up”
In today’s STEM-driven world, data from The Nation’s Report Card show how factors inside and outside the classroom support student achievement.
"Seeing these gains in science from our fourth- and eighth-graders makes me hopeful about the future of our nation’s students," said former Wyoming Gov. James Geringer, director of policy and public sector strategies at the Environmental Systems Research Institute and member of the National Assessment Governing Board, which sets policy for NAEP. "But that progress needs to continue since only about one-third of students, or even fewer, have the science skills they need."
The National Assessment of Educational Progress (NAEP) — known as The Nation’s Report Card — is the largest nationally representative, continuing assessment of what America’s students know and can do in various subjects. The 2015 science assessment measured students’ knowledge of physical science, life science, and Earth and space sciences. The assessment also measured how well students implement science practices, like using scientific principles and engaging in scientific inquiry.
National science results are available for students at grades four, eight, and 12; state-level results are available at grades four and eight.
National Highlights
Performance Improves At Grades Four And Eight
- At grades four and eight, students scored higher in 2015 than in 2009 in all three science content areas: physical science, life science, and Earth and space sciences.
- From 2009 to 2015, the percentage of students performing below the Basic achievement level decreased by 4 percentage points at grades four and eight.
Score Gaps Narrow By Race And Gender At Grades Four And Eight
- The score gaps between black and white students and between Hispanic and white students at both grades four and eight have narrowed since 2009.
- In 2015, fourth-grade male students scored about the same as fourth-grade female students, eliminating the gender difference.
- At grade eight, male students scored higher than female students, but the difference between their scores in 2015 was smaller than the difference between their scores in 2011 (3 points versus 5 points).
- At grade 12, male students outperformed female students by 5 points. The gap between their scores in 2015 was not statistically different from the 2009 gap.
State Highlights
Some Sizable Gains Made At Grades Four And Eight
- Between 2009 and 2015, scores at both grades rose in 15 states and jurisdictions: Arizona, Arkansas, Department of Defense Education Activity (DoDEA) schools, Florida, Georgia, Hawaii, Indiana, Mississippi, North Carolina, Oklahoma, South Carolina, Tennessee, Texas, Utah and Wyoming. Of these, DoDEA schools, Tennessee, Utah and Wyoming had a percentage of students performing at or above Proficient that was greater than the average percentage for national public schools in 2015.
- From 2009 to 2015, four states and jurisdictions showed score gains at grade four that were larger than the national average score gain: Arizona, DoDEA schools, Georgia and Tennessee. At grade eight, three states had this distinction: Nevada, Tennessee and Utah.
Score Gaps Narrow And Close By Race And Gender
- The following states saw a statistically significant narrowing of average score gaps between black and white students from 2009 to 2015: Arkansas (a decline of 10 points), Oklahoma (8.9) and Tennessee (8.6) at grade four; and Illinois (7.8) at grade eight.
- The following states saw a statistically significant narrowing of the average score gap between Hispanic and white students from 2009 to 2015: Massachusetts (a decline of 8.7 points), Connecticut (8.2), Illinois (6.7) and Nevada (5.9) at grade four; and New York (8.9), Illinois (7.4), Connecticut (7.1), Wyoming (6.9) and Arizona (5.6) at grade eight.
- For fourth grade, several states closed the average score gap by gender — meaning statistically significant score differences between female and male students were found in 2009 but not in 2015 — specifically, Hawaii (a decline of 4.2 points), Maine (3.5), North Carolina (2.4), South Dakota (2.4) and Ohio (1.8).
- The gender score gap closed at grade 8 in Wyoming (a decline of 6.5 points), Rhode Island (6.4), New Mexico (4.8), Georgia (4.6), and Montana (4.0), and in 13 other states.
Tennessee stands out as a state that showed large score gains at grades four and eight and narrowed score gaps between black and white fourth-graders from 2009 to 2015, and its students are outperforming the nation (public schools) at grades four and eight.
"We’ve set high expectations across the board for our students in Tennessee, and our NAEP performance continues to reflect the hard work and progress our students and teachers are making," said Candice McQueen, Tennessee commissioner of education. "To me, the most encouraging part of today’s science results is that all of Tennessee’s students are showing what is possible. We’ve narrowed or eliminated gaps between groups of students, and we are continuing to make huge strides in where we have been historically to build a new future for our children."
Parents should expose kids to science outside of school, even if it’s just taking a walk through a park Susan German, @MOEducation teacher
Emphasizing science in and outside of the classroom is tied to student performance in the subject, as shown in data collected through NAEP student and teacher questionnaires about educational experiences. Overall, students with more exposure to science scored better on the 2015 science assessment than students with less exposure:
- Eighth-graders who participate in hands-on activities or investigations in science class every day or almost every day, as reported by their teachers, scored 12 points higher than students who never or hardly ever engage in these activities.
- Eighth-grade students who self-reported that they have visited a museum, zoo or aquarium to learn about science outside of a school trip scored 7 points higher than students who have not participated in those activities outside of school.
- Students who have teachers with access to school-provided scientific tools for teaching science — such as telescopes, microscopes and thermometers — also scored higher. Eighth-graders whose teachers reported the highest level of access to these tools scored 16 points higher than eighth-graders whose teachers reported no access. Twelfth-graders who reported having access to such tools scored 37 points higher than 12th-graders without access.
"Students who have more opportunities to dig in deep and fully engage do better in science," said Missouri science teacher Susan German, a panelist at the Oct. 27 event announcing the NAEP results. "They should be spending less time buried in a textbook and more time doing hands-on activities, such as investigating which insulator works best in keeping soda cold or how height and mass influence the size of impact craters. Parents should do as much as they can to expose their children to science outside of the classroom too — even if it’s as simple as taking them on a walk through a park."
The 2015 science assessment was conducted in grades four, eight and 12 and reported at the national level for each. State-level results for grades four and eight are available for 46 states and U.S. Department of Defense schools that voluntarily participated in the assessment. (Alaska, Colorado, the District of Columbia, Louisiana and Pennsylvania did not have the necessary sample size in 2015 for state-level results to be reported.) For grades four and eight, national results reflect the scores of both public and private school students, while state-level results reflect the scores of public school students only.
NAEP performance results are presented as average scale scores and as achievement levels, reported as the percentages of students performing at or above Basic, Proficient and Advanced. Basic denotes partial mastery of the subject, Proficient denotes competency over challenging subject matter and Advanced represents superior work. Scale scores range from 0 to 300. Because NAEP scores and achievement levels are developed independently for each subject, results cannot be compared across subjects. Performance results also cannot be compared with data from before 2009, when the new science framework was introduced. The last assessment for fourth- and 12th-graders took place in 2009, and the last assessment for eighth-graders was administered in 2011.
See the full report card here.
Stephaan Harris
- Phone
- (202) 357-7504
- Stephaan.Harris@Ed.Gov