2015 Reading TUDA
U.S. Math Scores Decline From 2013; Nation’s Reading Scores Mixed
Some States and Urban Districts Show Improvement in 2015 NAEP Math and Reading
WASHINGTON — Since 2013, national average mathematics scores have decreased for fourth-and eighth-grade students, while reading scores have held steady for fourth-graders and have gone down for eighth-graders, according to The Nation’s Report Card: 2015 Mathematics and Reading. Overall scores in both subjects at both grades are higher than they were in the 1990s when the assessments were first administered. However, the percentage of students scoring at or above the Proficient level — indicating a solid grasp of the subject matter — has declined since 2013 in fourth-and eighth-grade mathematics and in eighth-grade reading. The percentage of fourth-graders scoring at or above Proficient in reading did not change from 2013.
The National Assessment of Educational Progress (NAEP), also known as The Nation’s Report Card, provides results for the nation, states/jurisdictions and selected urban districts. Fourth-grade students in three states/jurisdictions improved in math, and fourth-grade students in 13 states/jurisdictions improved in reading. No state saw improvements for both grades in reading and in mathematics.
Release Event: 2015 Reading
The Governing Board hosted a release event at a D.C. elementary school to discuss the findings of the 2015 reading report card.
Of the 21 large urban districts that volunteered to participate in NAEP’s Trial Urban District Assessment (TUDA) in 2015, six saw improved scores from 2013 for at least one grade and one subject; one urban district, Duval County, Florida, participated for the first time in 2015, so its scores could not be compared to previous assessments. Mathematics scores increased in four urban districts and decreased in 10 urban districts in at least one grade. Reading scores increased in five urban districts and decreased in three urban districts in at least one grade.
#NAEP data helps urban school leaders to address what’s not working and to build on what is. Eric Gordon, @CLEMetroSchools CEO
“While the downturn in reading and math scores nationally and among states is concerning, especially in math, we are encouraged by the progress made by some of the participating urban districts,” said Terry Mazany, chair of the National Assessment Governing Board, which oversees NAEP. “Our nation’s schools and school districts are experiencing a lot of change and NAEP gives us an independent and objective long-term measure of student achievement and lets us know where we stand today compared to past performance.”
State Highlights In Mathematics
- Scores for fourth-graders increased in Mississippi, the District of Columbia and Department of Defense Education Activity schools and declined in 16 states. Scores did not change significantly in 33.
- Since 2013, scores for eighth-graders have decreased in 22 states and remained flat in 30.
- Scores have improved in both grades in every participating state since the first state-level assessment in the early 1990s.
Urban District Highlights In Mathematics
- The scores of fourth-graders in the Dallas Independent School District, District of Columbia Public Schools (DCPS) and Miami-Dade County (Florida) Public Schools have increased since 2013.
- The percentage of students in both grades performing at or above Proficient in Charlotte, N.C., was greater than the percentage of public school students at or above Proficient nationwide.
- Chicago eighth-graders scored higher in 2015 than in 2013.
Mathematics – This assessment addressed five mathematical content areas: number properties and operations; measurement; geometry; data analysis, statistics and probability; and algebra. Fourth-grade students with scores in the Proficient range could likely divide a three-digit whole number by a one-digit whole number. Eighth-graders scoring in the Proficient range could likely translate a verbal statement into an equation.
“Many states and urban districts have made huge changes in mathematics instruction and curricula these past two years,” said Governing Board Vice Chair Lucille E. Davy, former commissioner of the New Jersey Department of Education. “While some scores went down in 2015, others went up, so it will be important to watch how the data shift over the next couple of years to understand if this year’s scores are part of a greater trend.”
State Highlights In Reading
- 0 states/jurisdictions had a higher percentage of students at grade 8 performing at or above Proficient than did the nation.
- Since 2013, fourth-grade reading scores have decreased in Maryland and Minnesota and increased in 13 states, including Mississippi, which also saw a gain in math.
- Since 2013, eighth-grade reading scores have increased in West Virginia and decreased in eight states.
- Students in many participating states have improved in both grades since the first state-level assessment in the 1990s.
Urban District Highlights In Reading
- Since 2013, reading scores have increased in five urban districts: in Miami-Dade, Fla., for eighth-graders, and in Boston, Chicago, Cleveland and DCPS for fourth-graders.
- The percentage of students at grade 4 performing at or above Proficient in Charlotte, N.C., and Hillsborough County, Fla., was greater than the percentage of public school students at or above Proficient nationwide.
- Eighth-graders’ scores have not changed significantly in 16 urban districts and have decreased in three since 2013.
Reading – This assessment includes two types of texts: literary and informational. The questions measure students’ ability to locate and recall, integrate and interpret, and critique and evaluate. Fourth-grade students with scores in the Proficient range could likely explain the importance of character to story action using an example as support. Eighth-graders scoring in the Proficient range could likely evaluate information in an expository passage to form and support an opinion.
“The Nation’s Report Card’s distinctive, apples-to-apples comparison data are critical for urban school leaders to meaningfully address what’s not working and to confidently build on what is,” said Eric Gordon, CEO of the Cleveland Metropolitan School District, which has participated in TUDA since 2003. “For Cleveland, the results affirm how implementation of the Common Core curriculum and changes in the way we use time, talent and resources in our schools are key contributors to gains in student achievement.”
The assessment also includes questions about students’ home and school experiences, and responses, which provide additional context for (but not causal relationships to) performance. For example, fourth-graders who responded that they “often” like what is done in math class had an average score of 246, while those who responded “never or hardly ever” had an average score of 232. The average score of fourth-graders who said they talk with friends about what they read “once or twice a week” was 231; those who responded “never or hardly ever” had an average score of 220.
NAEP reports performance using average scores and percentages of students performing at or above three achievement levels: Basic, Proficient and Advanced. The Basic level denotes partial mastery of the knowledge and skills needed for grade-appropriate work; Proficient denotes solid academic performance; and Advanced represents superior work. The National Center for Education Statistics administered the assessments to samples of more than 130,000 students in each grade for which results were reported.
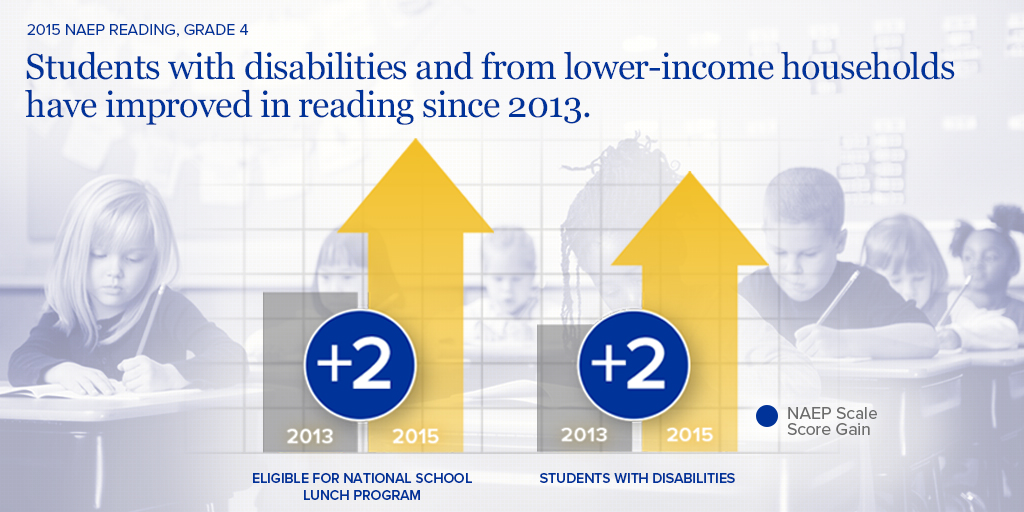
The results are segmented by student group according to income level, eligibility for the National School Lunch Program; gender; disability status; and racial/ethnic background. Compared with 2013, reading scores in 2015 went up among fourth-grade students with disabilities and fourth-graders eligible for the National School Lunch Program. Segmenting the results by student group also allows for comparisons between groups.
Stephaan Harris
- Phone
- (202) 357-7504
- Stephaan.Harris@Ed.Gov