Framework for the Assessment
Content Strands
This chapter further discusses the rationale for recommendations presented in chapter one. The framework for the NAEP mathematics assessment is anchored in broad strands of mathematical content:
- Number Sense, Properties, and Operations
- Measurement
- Geometry and Spatial Sense
- Data Analysis, Statistics, and Probability
- Algebra and Functions
These strands are not intended to divide mathematics into discrete elements. Rather, they are intended to provide a helpful classification scheme that describes the full spectrum of mathematical content assessed by NAEP.
The 1990 and 1992 NAEP mathematics assessments made use of matrix frameworks to specify items by both content strand and mathematical ability, as shown in figure 1. The use of such frameworks provided strong guidance for the construction of the assessment in terms of breadth. Nonetheless, this type of structure tended to work against the curricular goal of integrating mathematical knowledge across topics.
Figure 1. Framework for the 1990 and 1992 Mathematics Assessments
| Mathematical
Abilities |
Content Areas | ||||
|---|---|---|---|---|---|
| Numbers and Operations | Measurement | Geometry | Data Analysis, Statistics, and Probability | Algebra and Functions | |
| Conceptual Understanding |
|||||
| Procedural Knowledge |
|||||
| Problem Solving | |||||
Additionally, on secondary analyses of the NAEP items, expert panels often had difficulty replicating the assignment of items to cells of the matrix on the basis of the mathematical ability classifications. Classifications varied with the rater’s conceptions of students’ abilities of children in grades 4, 8, or 12 rather than with the definitions of the mathematical abilities. The strict application of the mathematical abilities classifications in conjunction with the content strands led to a forced fit of items to achieve balance across the two-dimensional matrix rather than to match the goals of mathematics education.
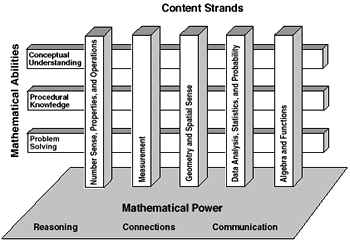
In real life, few mathematical situations fall clearly in one content strand or another, and few naturally reflect only one facet of mathematical thinking. Yet, to ensure a broad scope in test construction, items must be classified several ways. To address this issue of item classification, the current framework for mathematics assessments focuses primarily on the mathematical content strands, with additional specifications related to an assessment dimension referred to as “mathematical power,” as shown in figure 2.
Figure 2 shows that the curriculum is conceived as consisting of content drawn from five broad mathematical areas. Items are classified according to the major area(s) they address, including both mathematical abilities and mathematical power. Mathematical power is conceived as consisting of mathematical abilities (conceptual understanding, procedural knowledge, and problem solving) within a broader context of reasoning and with connections across the scope of mathematical content and thinking. Communication is viewed as both a unifying thread and a way for students to provide meaningful responses to tasks.
In recent NAEP administrations, the concept of mathematical power as reasoning, connections, and communication played an increasingly important role in measuring student achievement. In 1990, the assessment included short-answer open-ended items as a way to begin to address mathematical communication. The extended open-ended items included on the 1992 assessment required students not only to communicate their ideas but also to begin to demonstrate the reasoning they used to solve problems. The new assessment items focus even more attention on mathematical power by continuing deliberate attention to reasoning and communication and by providing students with opportunities to connect their learning across mathematical content strands. These connections are addressed through individual items designed to tap more than one content strand or more than one ability, as well as across items through the use of item families.
Families of related items were designed to sample the depth of students’ knowledge within a particular strand and students’ ability to deal with concepts, principles, or procedures across content strands. Within a family, items may cross content areas, mathematical abilities, and/or grade levels. This type of grouping in the design of the assessment allows a more indepth analysis of student performance than would a collection of discrete items. Individual student performance, comparisons of student performance across grade levels and strands, and comparisons of student performance across assessments with respect to a family of items provide another way to assess areas of strength and weakness.
A more detailed discussion of each content strand is provided in chapter three, and more detailed descriptions of item types are provided in chapter five.
The distribution of items among the various mathematical content strands is a critical feature of the assessment design, as it reflects the relative importance and value given to each strand. In the past six NAEP assessments in mathematics, the categories received differential emphasis, and the differentiation continues in the framework for the 1996, 2000, and 2003 assessments. The recommended distribution of items to the strands continues to move toward a more even balance among the strands and away from the earlier model, in which items reflecting number facts and operations composed more than 50 percent of the assessment item bank.
Another significant difference in the new assessment is that items may be classified in more than one strand. In addition to describing minimum percentages of the item pool that should address each strand, note that maximum percentages are listed for the Number Sense, Properties, and Operations strand to ensure that the balance is maintained. Table 1 provides the recommended mix of items in the assessment by content strand for each grade (4, 8, and 12).
|
Content Strand
|
Grade 4 | Grade 8 | Grade 12 |
|---|---|---|---|
| Number Sense, Properties, and Operations* (minimum/maximum) |
40/70
|
25/60
|
20/50
|
| Measurement |
20
|
15
|
15
|
| Geometry and Spatial Sense |
15
|
20
|
20•
|
| Data Analysis, Statistics, and Probability |
10
|
15
|
20
|
| Algebra and Functions |
15
|
25
|
25
|
Note: An item may be classified in more than one category.
*At least half of the items in Number Sense, Properties, and Operations at each grade level should involve some aspect of estimation or mental mathematics. No more than the specified maximum percent of the items at any grade level should have a major classification in this strand.
•At grade 12, 25 percent of the items in the geometry strand should involve topics in coordinate geometry.
These guidelines for balance present a minimum target for representation across mathematical content strands. For Number Sense, Properties, and Operations, note that a maximum target is also provided. This target is intended to reinforce the shift away from a narrow number and computation focus to a more comprehensive view of mathematics. An item should be classified according to its predominant strand; it may be classified under two or more strands if it addresses substantive content from more than one area. In fact, at least half of the new items should have major elements drawn from more than one strand, and they should be categorized in those strands. This means that the percentages listed in table 1, when translated into data on the actual item pool, will result in a percentage of items greater than those listed and will add up to more than 100 percent. Additionally, the number of items reflecting connections among strands should continue to increase in subsequent assessments to move NAEP assessments ever closer to the goal of students having the opportunity to demonstrate mathematical power in various situations requiring connections within mathematics and with other disciplines.
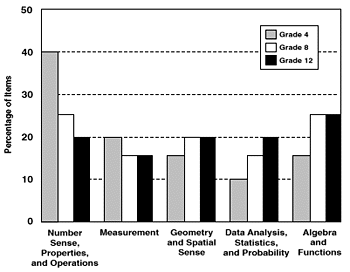
Figure 3 shows the percentage of items by content strand and grade level on the NAEP mathematics assessment. The emphasis given to Number Sense, Properties, and Operations in grade 4 shifted toward growing emphases in Geometry and Spatial Sense; Data Analysis, Statistics, and Probability; and Algebra and Functions in the later grades.
Figure 3. Percentage of Items, by Content Strand and Grade Level (Minimum percentages shown)
Mathematical power can be thought of as an extension of “ mathematical abilities,” as the term was used in the 1990 and 1992 mathematics assessments. The mathematical abilities described in the framework for these assessments (procedural knowledge, conceptual understanding, and problem solving) specifically addressed aspects of knowing and doing mathematics. Nonetheless, the development of assessment items based only on a rigid content-by-process matrix has led to a contrived separation and artificial contexts. Indeed, expert reviewers of the 1990 assessment often were unable to agree on the best placement for some items in the framework matrix.
The current specifications are designed to incorporate the overarching standards for communicating, reasoning, and connecting, as well as the categories of conceptual understanding, procedural knowledge, and problem solving. The following recommendations are intended to guide the development of actual items for the 1996 and future NAEP mathematics assessments. These guidelines are provided to assist in reviewing the overall balance in the assessment and ensure that the assessment reflects some balance among “knowing that or knowing about,” “knowing how,” and “solving problems,” within an overall demonstration of mathematical thinking in various situations. Chapter four includes a more indepth discussion of mathematical power, mathematical abilities, and additional aspects of mathematical thinking as they relate specifically to the current and future mathematics assessments.
Guidelines for balancing the mix of conceptual understanding, procedural knowledge, and problem-solving items should be evaluated only in terms of the total item package at each grade level, not in each individual strand. As in the content classification, classification according to these three mathematical abilities need not—in fact should not—be forced into individual categories. Rather, an item will likely include elements of more than one of these three, and it should be classified in as many of these categories as is appropriate for the major thought processes required.
At each grade level, at least one-third of the items should be classified as conceptual understanding, at least one-third should be classified as procedural knowledge, and at least one-third should be classified as problem solving. Items with a major element of procedural knowledge in addition to either conceptual understanding or problem solving should not make up the majority of items at any grade level.
To present a more complete picture of national mathematics performance, there should be an increase in the total number of items in the assessment and the number of items requiring student-constructed responses. In particular, any increase should reflect at least a doubling of the number of extended open-ended items contained in the 1992 NAEP assessment and an attempt to equalize the number of short-answer and multiple-choice items.
The percentage distributions presented here, the lists of topics provided in chapter three, and the described elements of mathematical power are not intended to prescribe curriculum standards; rather, they are designed to construct a complete and balanced assessment instrument reflecting best practice in mathematics education at each grade level. An analysis of student performance across all items will permit NAEP to report on average mathematics proficiency. In addition, analysis of performance on subsets of items will permit reporting on patterns of achievement in each of the five strands.
In recent NAEP assessments, students have been provided calculators to gather information on certain blocks of items measuring ability to use calculators in mathematical situations. However, some items require students to demonstrate computation or estimation skills without the use of a calculator.
In the 1996, 2000, and 2003 assessments, calculators were provided on about one-third of the assessment. Students do not have access to a calculator on the about two-thirds of the exam. At grade 4, NAEP provides students with a four-function calculator. At grades 8 and 12, students are provided with a scientific calculator by NAEP.
Starting with the 1990 assessment, students were provided rulers and protractors for use on some tasks on the assessments. With the 1992 assessment, students received some geometric shapes to use in responding to items requiring the analysis of relationships between these shapes and more complex shapes that could be formed from the pieces. Assessments in 1996, 2000, and 2003 expanded this practice, especially in settings in which students are given extended time to work with materials that can be easily included in such a large-scale assessment.
| Previous | Contents | Next |
| Mathematics Framework for the 2003 National Assessment of Educational Progress |
|